Building an M&E System from Scratch: A Step-by-Step Guide
November 21, 2024 2024-11-21 17:32Building an M&E System from Scratch: A Step-by-Step Guide
Imagine trying to navigate a ship without any instruments – no compass, no radar, no depth finder. That’s exactly what running a project without a monitoring and evaluation (M&E) system feels like. Whether you’re a small NGO just starting out or a growing organization ready to formalize your impact measurement, building an M&E system from scratch can seem overwhelming. But it doesn’t have to be.
This comprehensive guide will walk you through the process of building a practical, sustainable M&E system that works for your organization’s needs and capacity. No jargon, no unnecessary complexity – just straightforward steps and practical advice from years of field experience.
Table of Content
1. Understanding M&E System Basics
What is an M&E System?
At its core, an M&E system is like your organization’s GPS and dashboard combined. It’s not just about collecting data – it’s an interconnected set of tools, processes, and people that help you:
- Track progress toward your goals
- Make informed decisions about your projects
- Learn from what works (and what doesn’t)
- Demonstrate impact to stakeholders
- Improve program effectiveness
Think of it as your organization’s nervous system – collecting information, processing it, and helping you respond appropriately.
Key Components of an M&E System
Every effective M&E system consists of six essential components:
- People: The team members who will collect, analyze, and use the data
- Processes: The steps and procedures for how data flows through your organization
- Tools: The forms, software, and methods you’ll use to collect and analyze data
- Data Management: How you’ll store, protect, and organize your information
- Analysis & Learning: How you’ll make sense of the data and use it to improve
- Reporting & Use: How you’ll share findings and incorporate them into decision-making
Benefits of a Well-Designed M&E System
When done right, your M&E system will:
- Save time by automating routine data collection
- Improve project outcomes through data-driven decisions
- Increase funding opportunities with better impact reporting
- Build team capacity and organizational learning
- Enhance accountability to beneficiaries and donors
- Provide early warning signals when interventions aren’t working
The key is starting simple and building gradually. You don’t need to implement everything at once – start with the basics and expand as your organization grows.
2. Pre-Development Phase
Before diving into building your M&E system, you need to lay the proper groundwork. This phase is like checking your ingredients and tools before starting to cook – it’s essential for success.
Assessing Organizational Readiness
Start by honestly evaluating your organization’s current state:
Quick Readiness Checklist:
- Does leadership support M&E initiatives?
- Do you have basic resources (time, people, budget)?
- Are staff members open to learning new processes?
- Do you have clear project objectives?
- Can you identify what data you really need?
Remember: You don’t need everything to be perfect to start. You just need to know where you stand.
Securing Management Buy-in
M&E systems often fail without strong leadership support. Here’s how to get it:
- Make the Business Case
- Link M&E to organizational goals
- Show cost-benefit analysis (time saved, better funding opportunities)
- Present success stories from similar organizations
- Address Common Concerns
- Cost: Start small, show value, then scale
- Time: Demonstrate how good M&E saves time long-term
- Complexity: Present a phased approach
Resource Requirements
Be realistic about what you’ll need:
Human Resources:
- M&E focal point (doesn’t need to be full-time initially)
- Data collectors (can be existing program staff)
- Basic data analysis skills (can be developed over time)
Financial Resources:
- Initial setup costs (tools, software, training)
- Ongoing costs (staff time, data collection, analysis)
- Training and capacity building
Technical Resources:
- Basic computers and internet connection
- Data collection tools (can start with simple forms)
- Data storage solution (can begin with spreadsheets)
Stakeholder Mapping and Engagement
Create a simple stakeholder map answering these questions:
- Who needs what information?
- Donors: Impact reports, financial accountability
- Management: Progress tracking, decision-making data
- Field staff: Activity monitoring, beneficiary feedback
- Beneficiaries: Project progress, community involvement
- How will they use the information?
- Decision-making
- Reporting
- Learning
- Communication
- How often do they need updates?
- Weekly
- Monthly
- Quarterly
- Annually
Pro Tip: Create a simple matrix to track these requirements and use it as a reference when designing your system.
Quick Action Steps:
- Complete the readiness checklist
- Draft a basic resource needs document
- Create your stakeholder map
- Have initial conversations with key stakeholders
- Document current data collection practices (if any)
Remember: The goal of this phase isn’t to solve all problems but to understand what you’re working with and what you need to address.
3. Planning Your M&E System
Think of this phase as creating your M&E blueprint. Just like building a house, good planning prevents costly mistakes later.
Developing the M&E Framework
Your M&E framework is like a master plan that shows:
- What you’re measuring
- Why you’re measuring it
- How you’ll measure it
- When you’ll measure it
- Who’s responsible for measurement
Simple Framework Template:

Creating a Theory of Change
Your theory of change (ToC) is your project’s story of how change happens. Keep it simple:
- Start with the End: What’s your ultimate goal?
- Work Backwards: What needs to happen to reach that goal?
- Identify Assumptions: What must be true for your logic to work?
Pro Tip: Use this simple format: “If we do X, then Y will happen, which will lead to Z, because [assumption]”
Setting SMART Indicators
Good indicators are like vital signs for your project. For each level (input to impact), choose indicators that are:
- Specific: Clear and unambiguous
- Measurable: Can be counted or observed
- Achievable: Realistic to collect
- Relevant: Actually tells you what you need to know
- Time-bound: Has clear timeframes
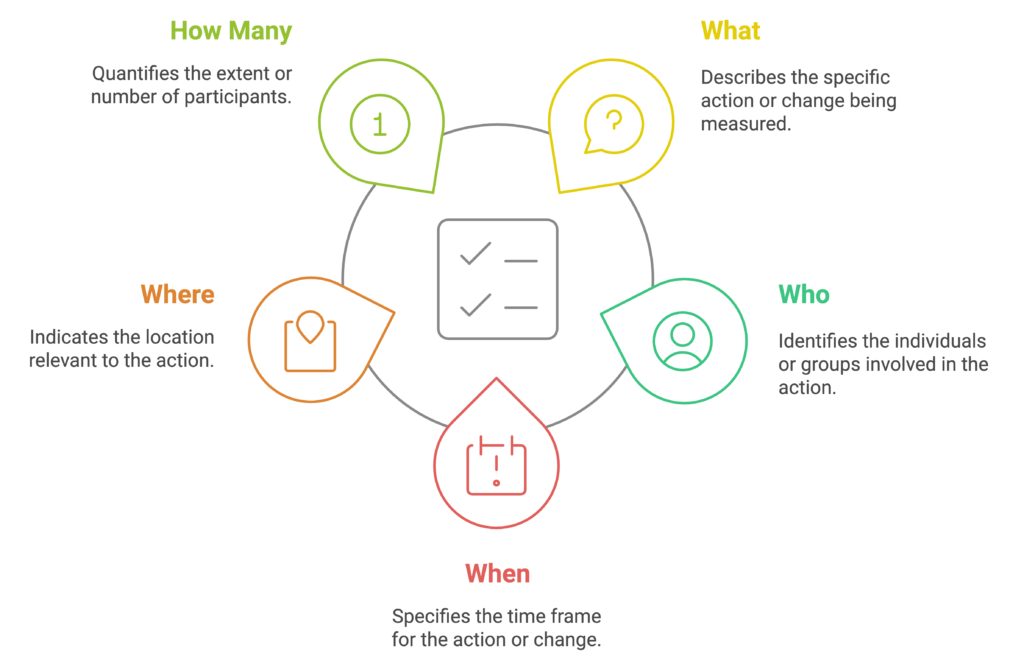
Example Structure:
Indicator: [What] + [Who] + [When] + [Where] + [How Many]
“Number of farmers [who] in Riverside District [where] who adopt improved farming practices [what] within 12 months of training [when]”
Establishing Data Flow Processes
Map out how data will move through your organization:
- Collection: Who collects what data?
- Field staff → Activity data
- M&E staff → Outcome data
- External evaluators → Impact data
- Processing: How does data move up?
- Analysis: Who analyzes what?
- Field staff: Basic activity analysis
- M&E staff: Trend analysis
- Management: Strategic analysis
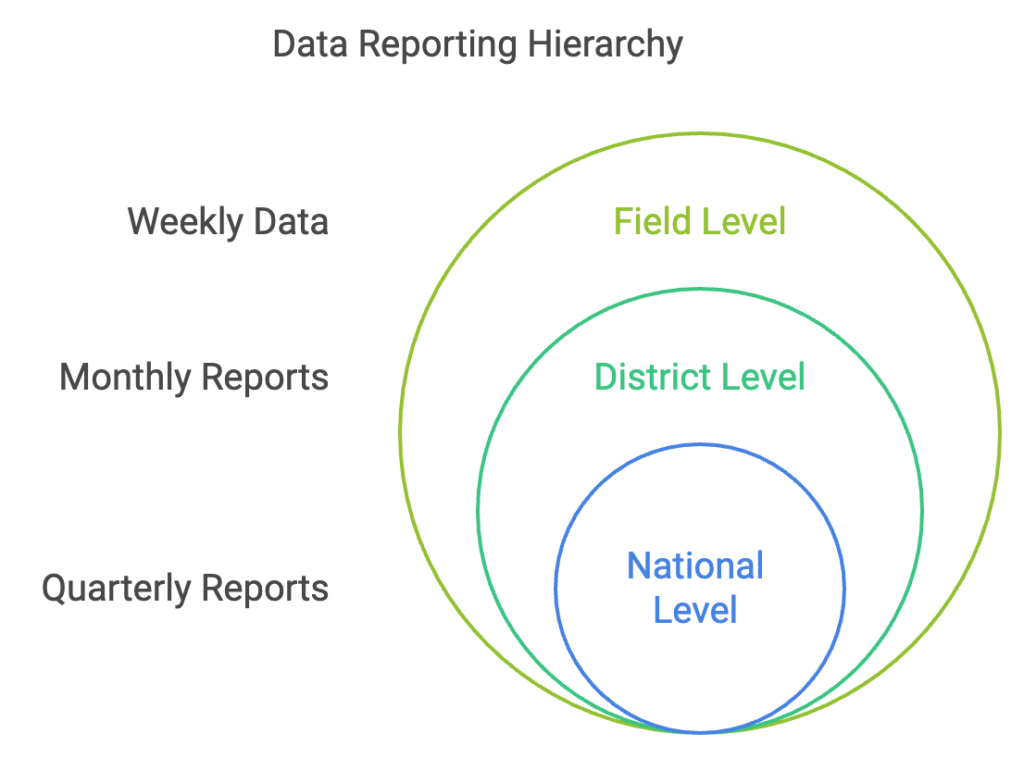
- Use: Who needs what reports?
- Field: Weekly activity updates
- Management: Monthly progress
- Donors: Quarterly reports
Roles and Responsibilities
Create a simple RACI matrix:
- Responsible: Who does the work?
- Accountable: Who makes decisions?
- Consulted: Who provides input?
- Informed: Who needs to know?
Example RACI Matrix:
| Task | Field Staff | M&E Officer | Manager | Donor |
|---|---|---|---|---|
| Data Collection | R | A | I | I |
| Data Entry | R | A | I | – |
| Analysis | C | R | A | I |
| Reporting | C | R | A | I |
Quick Planning Checklist:
- Draft M&E framework
- Create simple theory of change
- Define key indicators
- Map data flow
- Assign roles using RACI
- Get stakeholder feedback
- Revise based on feedback
Remember: Start simple and build complexity as needed. It’s better to have a basic system that works than a complex one that doesn’t.
4. Building the Infrastructure
This is where your M&E system takes physical form. Think of it like setting up your kitchen – you need the right tools in the right places to cook effectively.
Choosing Appropriate Tools and Methods
Select tools based on your needs, not what’s trendy. Consider:
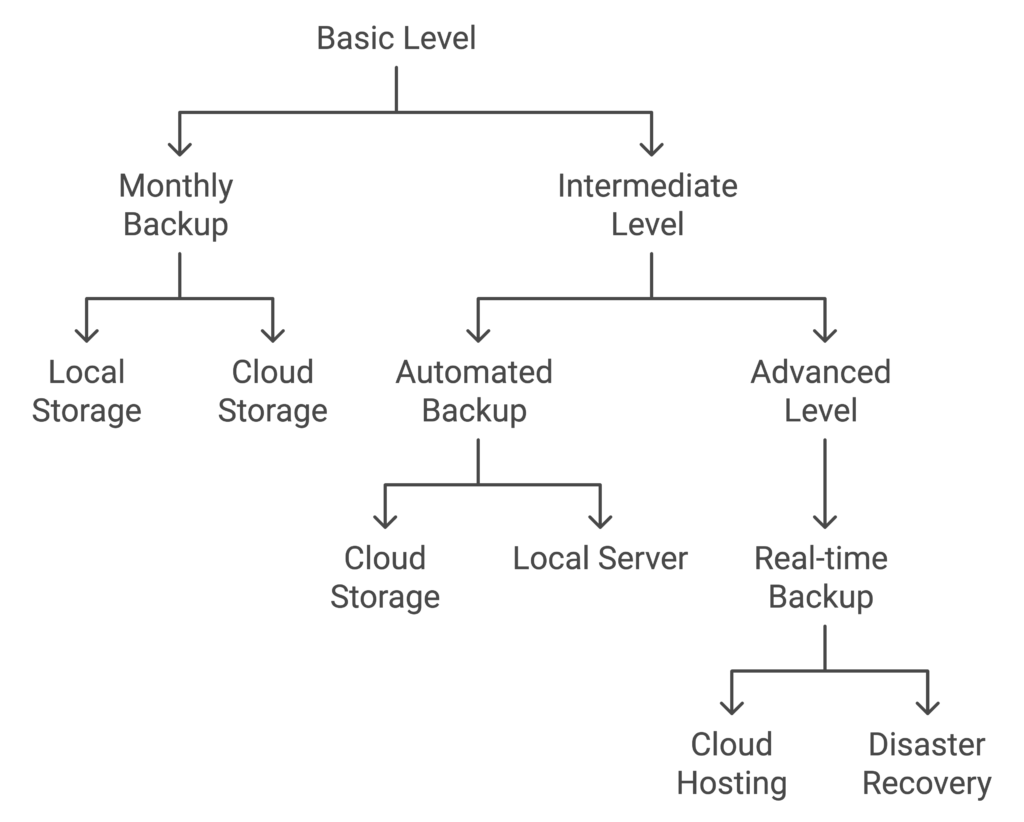
Data Collection Tools:
- Basic Level (Start here if you’re new)
- Google Forms
- Excel spreadsheets
- Paper forms (if technology access is limited)
- Intermediate Level
- KoBoToolbox
- ODK Collect
- CommCare
- Advanced Level
- Custom MIS systems
- Power BI
- Advanced databases
Selection Criteria Matrix:
| Tool Feature | Cost | Ease of Use | Offline Work | Analysis Features |
|---|---|---|---|---|
| Google Forms | $0 | High | No | Basic |
| KoBoToolbox | $0 | Medium | Yes | Good |
| Custom MIS | High | Low | Yes | Advanced |
Setting Up Data Collection Systems
- Form Design Best Practices:
- Keep it simple
- Use skip logic
- Include validation rules
- Test thoroughly before rolling out
- Standard Templates Needed:
- Beneficiary registration forms
- Activity monitoring sheets
- Outcome measurement tools
- Feedback collection forms
Creating Databases and Storage Solutions
Start simple and scale up:
Establishing Reporting Templates
Create standardized templates for:
- Activity Reports
What was planned vs. achieved - Challenges faced - Resources used - Next steps - Monthly Progress Reports
Key indicator progress - Budget utilization - Beneficiary feedback - Risk register - Donor Reports
Results against targets - Success stories - Lessons learned - Financial summary
Quality Assurance Mechanisms
Build in quality checks at every level:
Data Collection Level:
- Form validation rules
- Required fields
- Range checks
- Cross-validation
Data Entry Level:
- Double entry for critical data
- Automated validation rules
- Regular spot checks
Analysis Level:
- Peer review process
- Data cleaning protocols
- Outlier detection
Quick Implementation Checklist:
- Select appropriate tools
- Design and test forms
- Set up storage system
- Create report templates
- Implement QA processes
- Document all procedures
- Train staff on tools
Pro Tip: Create a simple technical manual documenting your setup. Include:
- Login credentials (stored securely)
- Backup procedures
- Troubleshooting guides
- Contact information for support
5. Implementation Process
The best-designed system is only as good as its implementation. This phase is about bringing your M&E system to life through people and processes.
Staff Training and Capacity Building
Core Training Package:
- Basic M&E Training (All Staff)
- M&E basics and importance
- Data collection ethics
- Basic data quality principles
- Role-specific responsibilities
- Technical Training (M&E Staff)
- Data collection tools
- Data analysis methods
- Report writing
- Database management
- Management Training (Leadership)
- Using data for decisions
- Resource allocation
- Quality oversight
- Results communication
Training Approach: Theory (20%) → Practice (50%) → Feedback (20%) → Refresh (10%)
Pilot Testing the System
Run a small-scale test before full rollout:
- Select Pilot Area
- Choose a representative sample
- Start with motivated staff
- Keep it manageable (1-2 months)
- Test Components:
- Data collection forms
- Data flow process
- Analysis procedures
- Reporting formats
- Gather Feedback:

Documentation and Standard Operating Procedures (SOPs)
Create simple, clear SOPs for:
- Data Collection
- Data Management
- Analysis and Reporting
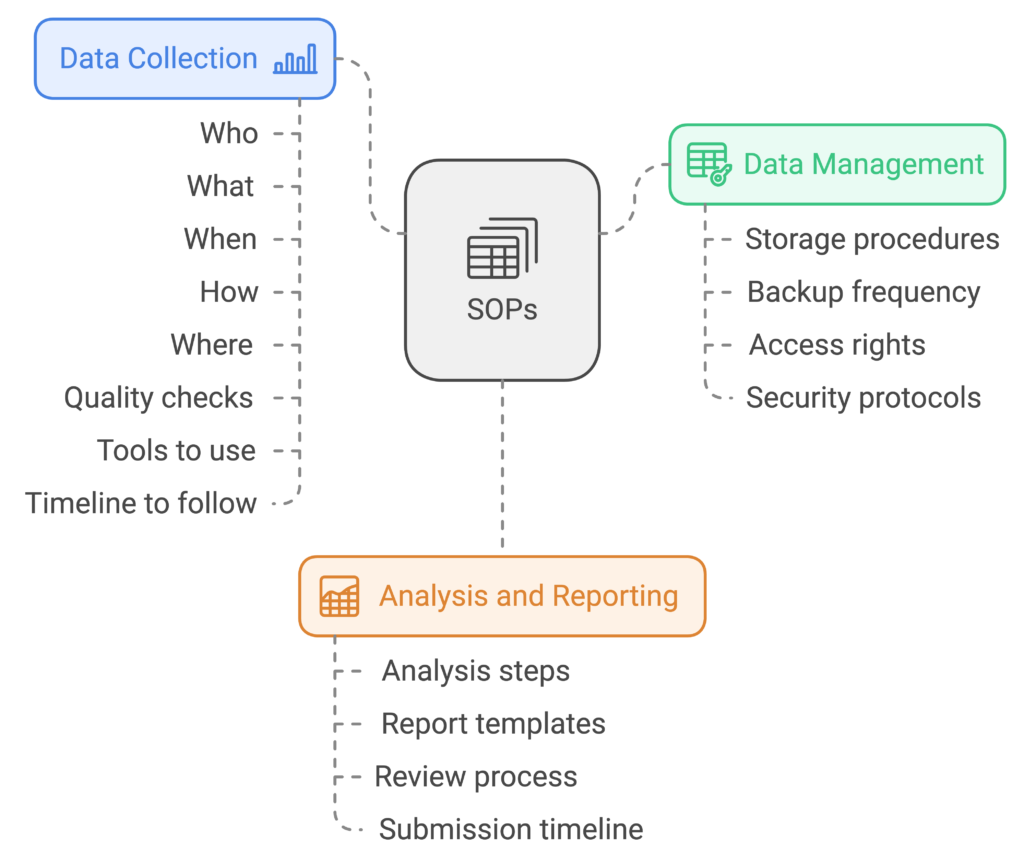
Pro Tip: Use flowcharts and checklists instead of long text documents.
Change Management Strategies
Remember: People naturally resist change. Plan for it:
- Communication Strategy
- Clear benefits
- Regular updates
- Open feedback channels
- Success celebrations
- Support System
- M&E champions in each team
- Peer support groups
- Help desk/focal point
- Regular check-ins
- Motivation Framework Short-term wins → Recognition → Skills growth → Career development
Implementation Timeline Example:
Month 1: Staff Training Month 2: Pilot Testing Month 3: Feedback & Revision Month 4: Phased Rollout Month 5: Full Implementation Month 6: Review & Adjust
Quick Implementation Tips:
- Start Small
- Begin with core indicators
- Add complexity gradually
- Learn from early experiences
- Build Confidence
- Celebrate early wins
- Share success stories
- Address concerns quickly
- Maintain Momentum
- Regular check-ins
- Ongoing support
- Continuous improvement
Implementation Checklist:
- Complete staff training
- Run successful pilot
- Document procedures
- Establish support system
- Monitor early adoption
- Gather regular feedback
- Make needed adjustments
Remember: Implementation is a journey, not a destination. Be patient and flexible as your team adapts to the new system.
6. Making it Sustainable
A sustainable M&E system is like a well-maintained garden – it needs regular attention and the right conditions to thrive.
Integration with Existing Systems
- Map Integration Points
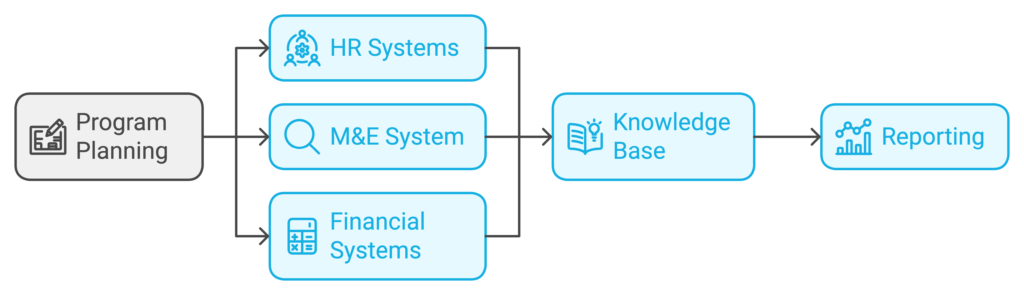
2. Process Alignment
- Link M&E to annual planning
- Align with budget cycles
- Connect to staff performance reviews
- Integrate with project management
Building Organizational Culture
Pro Tip: Create a simple “systems calendar” showing when different processes need to align.
Create a Learning Culture:
1.Regular Learning Events
- Monthly data review meetings
- Quarterly reflection sessions
- Annual learning workshops
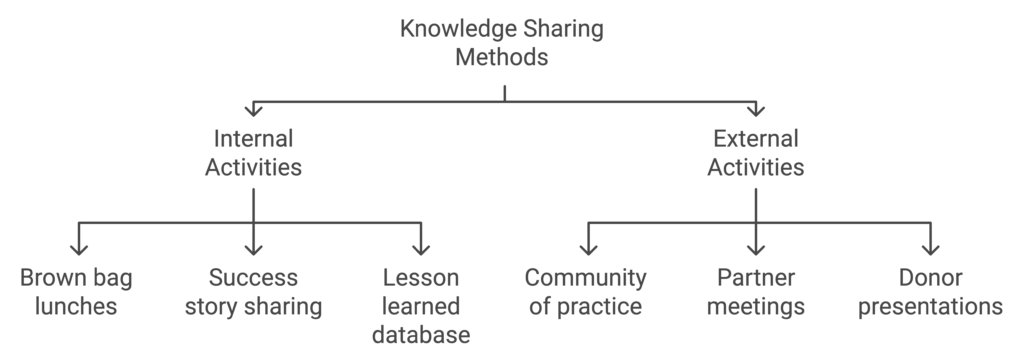
2.Knowledge Sharing Methods
3. Incentive Structure
- Recognize data use in decisions
- Celebrate learning from failures
- Reward innovation in M&E
- Include M&E in performance reviews
Regular Review and Updates
Review Cycle:
Monthly: Data quality checks
Quarterly: System performance review
Annually: Full system assessment
Key Review Areas:
- Efficiency
- Time spent on data collection
- Resource utilization
- Report production time
- Effectiveness
- Data quality scores
- Use of findings
- Stakeholder satisfaction
- Relevance
- Indicator usefulness
- Report utilization
- Decision-making support
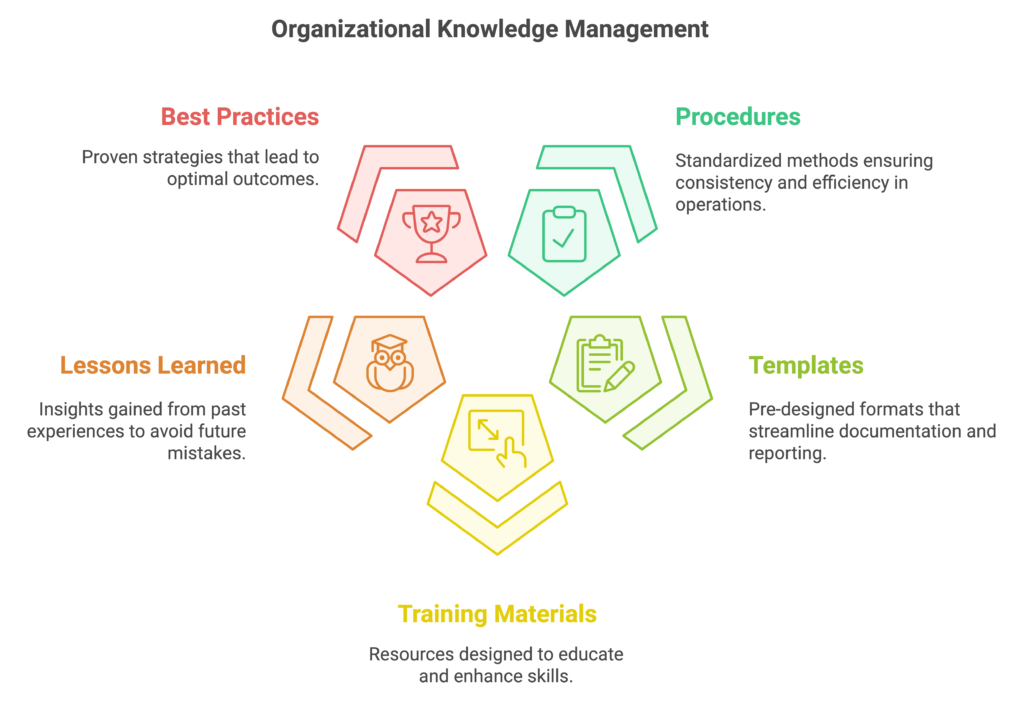
Knowledge Management
Create a simple knowledge management system:
Documentation Hub
- Access Levels
- Who needs what?
- When do they need it?
- How do they access it?
- Update Process
- Regular review schedule
- Version control
- Change documentation
- Staff notification
Budget Considerations
Cost Categories:
- Fixed Costs
- Staff salaries
- Software licenses
- Equipment maintenance
- Training materials
- Variable Costs
- Data collection
- Special studies
- External expertise
- Capacity building
- Emergency Fund
- System upgrades
- Emergency repairs
- Unexpected needs
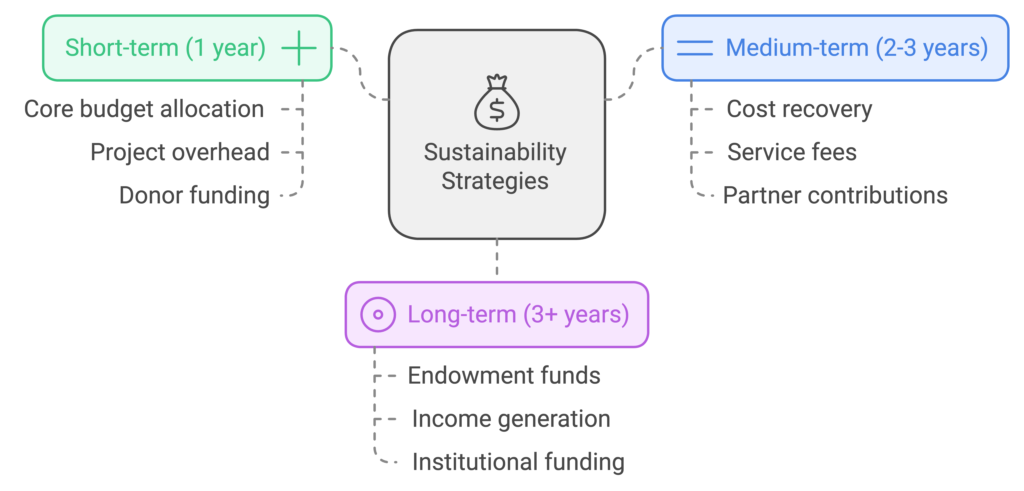
Sustainability Strategies:
Quick Sustainability Checklist:
- Integration plan created
- Learning events scheduled
- Review cycle established
- Knowledge system set up
- Budget secured
- Staff roles clear
- Updates planned
Success Indicators:
- Staff regularly use the system
- Data quality remains high
- Reports produced on time
- Decisions use M&E data
- Costs are manageable
- System evolves with needs
Remember: Sustainability isn’t about perfection – it’s about creating a system that can adapt and grow with your organization.
7. Common Pitfalls and How to Avoid Them
Understanding common mistakes helps you navigate challenges better. Let’s explore typical problems and their solutions.
Typical Challenges
Over-Complexity
| Symptoms: | Solutions: |
| Too many indicators Complex data collection Elaborate reports nobody reads Staff overwhelmed | Start with essential indicators only Use simple tools Create user-friendly reports Scale gradually |
Poor Data Quality
| Symptoms: | Solutions: |
| Inconsistent data Missing information Late submissions Unreliable analysis | Clear data standards Built-in validation Regular quality checks Staff training |
Low Buy In
| Symptoms: | Solutions: |
| Resistance to data collection Reports gathering dust Minimal feedback “Check-box” mentality | Show value early Celebrate wins Share success stories Make data useful |
Lessons Learned
From the Field:
- Technology Traps
- Don’t: Rush to expensive solutions
- Do: Start simple, test, then scale
- People Matter
- Don’t: Focus only on tools
- Do: Invest in staff capacity
- Data Collection
- Don’t: Collect everything possible
- Do: Focus on what you’ll actually use
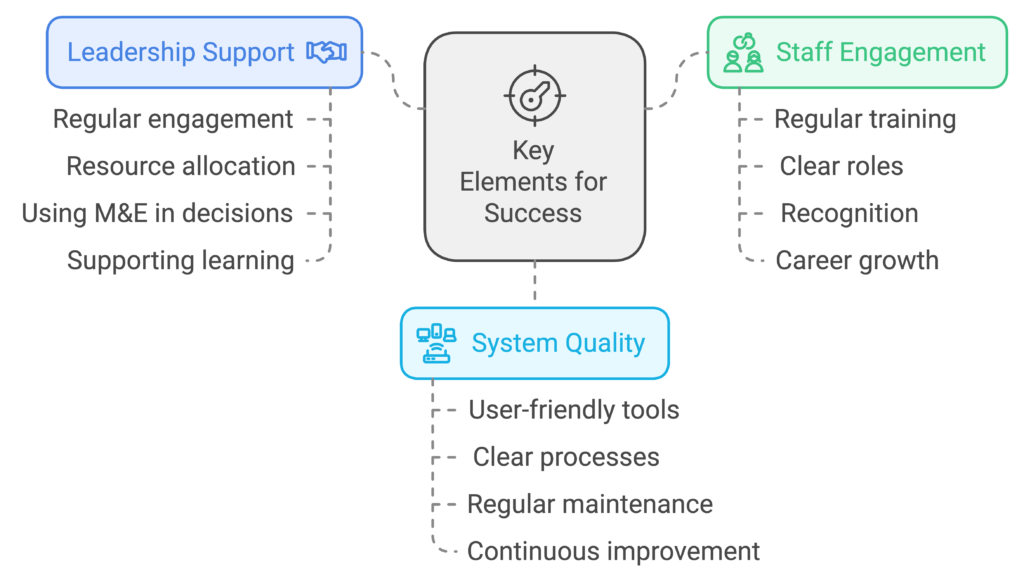
Success Factors
Key Elements for Success:
Troubleshooting Guide
Common Problems and Solutions:
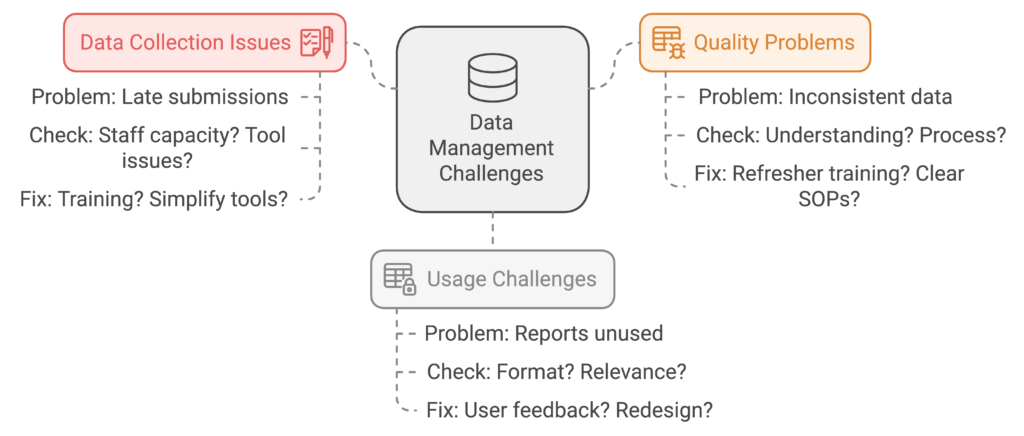
Quick Response Protocol:
Identify Issue → Analyze Cause → Plan Solution → Test Fix → Monitor Results
Prevention Strategies
- Regular Health Checks
- Monthly data quality reviews
- Quarterly system assessments
- Annual comprehensive evaluation
- Early Warning Signs–
Watch for: - Delayed submissions - Increasing errors - Staff complaints - Unused reports - Preventive Measures
- Regular training - System backups - Documentation updates - User feedback sessions
Quick Tips for Success:
- Keep it simple
- Focus on use
- Build capacity continuously
- Learn from mistakes
- Adapt and improve
- Celebrate progress
Remember: Problems are normal – it’s how you handle them that matters.
8.Key Takeaways
- Start Simple, Scale Smart
Basic → Functional → Advanced - Begin with core needs - Add features gradually - Learn and adapt - Success Formula
Good System = (Clear Purpose + Right Tools + Trained People) × Leadership Support - Remember the Basics
- Focus on usefulness
- Prioritize data quality
- Build staff capacity
- Maintain simplicity
Taking the Next Steps
If You’re Just Starting:
Week 1-2:
- Assess your needs
- Get leadership buy-in
- Identify resources
Month 1:
- Plan basic system
- Choose simple tools
- Train core team
Month 2-3:
- Start pilot phase
- Gather feedback
- Adjust approach
If You’re Improving an Existing System:
First:
- Review current state
- Identify gaps
- Set priorities
Then:
- Make targeted improvements
- Update processes
- Enhance capacity
Finally:
- Monitor changes
- Document learning
- Plan next phase
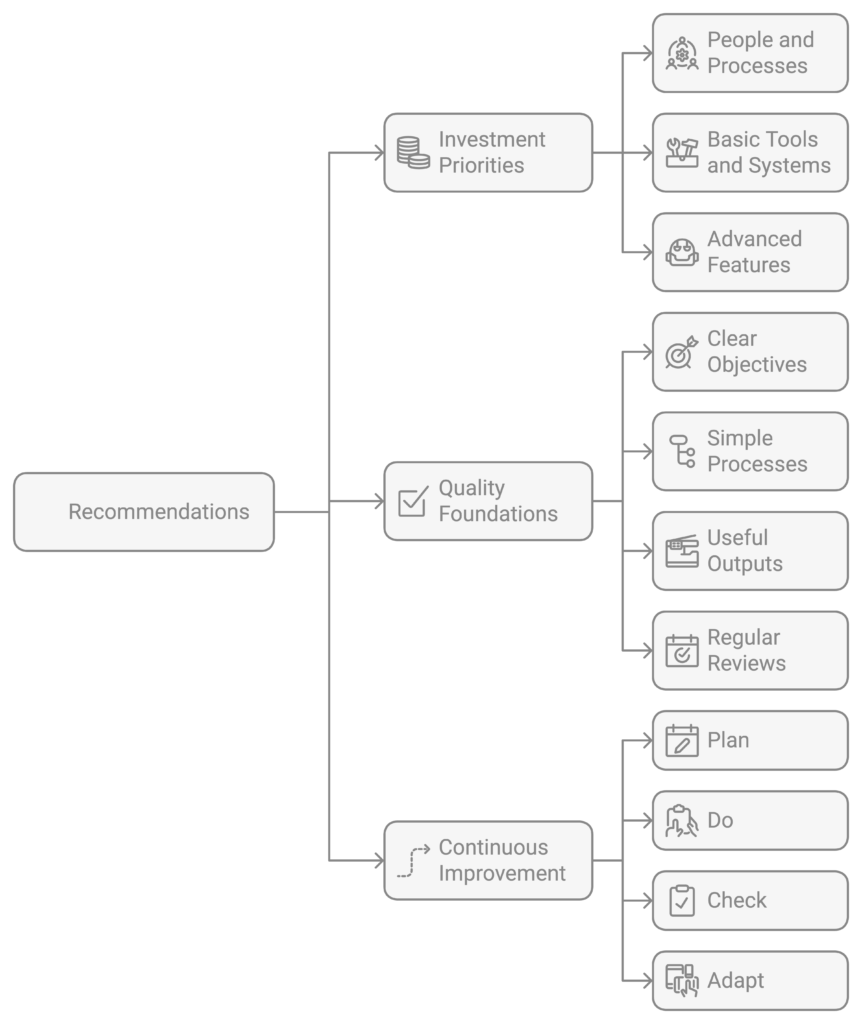
Final Recommendations
Related Posts