5 Proven Ways to Make M&E Reports Impossible to Ignore
February 11, 2026 2026-02-11 20:455 Proven Ways to Make M&E Reports Impossible to Ignore


From Forgotten PDFs to Powerful Change Agents
The 127-page M&E evaluation report sat unopened in the program director’s inbox. Three months of fieldwork. $45,000 in consultant fees. Sixteen stakeholder workshops. Two hundred interviews. All distilled into an M&E report that would never be read beyond the executive summary.
This wasn’t an isolated incident. Across the development sector, evaluation reports face a crisis of relevance. A 2023 study by the Centre for Evaluation Innovation found that 68% of evaluation reports are never fully read by intended users, and only 23% directly influence program decisions. We’re producing reports, but we’re not producing impact.
The problem is so pervasive that even the United Nations, the world’s largest international organization, isn’t immune. In August 2025, UN Secretary-General António Guterres released a sobering finding from the UN80 reform task force: the majority of UN reports are not widely read. Despite producing 1,100 reports in 2024 (a 20% increase since 1990), only the top 5% of UN reports are downloaded more than 5,500 times, while one in five reports receives fewer than 1,000 downloads. And as Guterres pointedly noted, ‘downloading doesn’t necessarily mean reading.’
“The sheer number of meetings and reports is pushing the system and all of us to the breaking point,” Guterres stated during the briefing. If the UN, with its global reach and resources, struggles to get its reports read, what chance do individual M&E consultants and implementing organizations have?
But some reports are different. They get read. They get discussed. They catalyze change. Having reviewed hundreds of M&E reports from both sides as a donor representative, implementing partner, and external evaluator, I’ve observed that memorable, impactful reports share five distinctive features. These aren’t about technical rigour or methodological sophistication, though those matter. These features transform evaluation findings from archived documents into action drivers.
Feature 1: Tell the Story Behind the M&E Results
Implementing partners already know their program results through progress reports and monitoring dashboards. Your evaluation report shouldn’t rehash what they already know; it should illuminate what they don’t: the story behind those numbers.
Why Stories Matter More Than Statistics
Behavioural economics research by Nobel laureate Daniel Kahneman demonstrates that people make decisions based on narratives, not data alone. Numbers inform; stories persuade. When Stanford researcher Jennifer Aaker studied what makes content memorable, she found that stories are up to 22 times more memorable than facts alone.
Consider two ways to report the same finding:
Version A (Data-Only): “The water project increased household water access by 73% and reduced women’s water collection time by an average of 2.3 hours daily.”
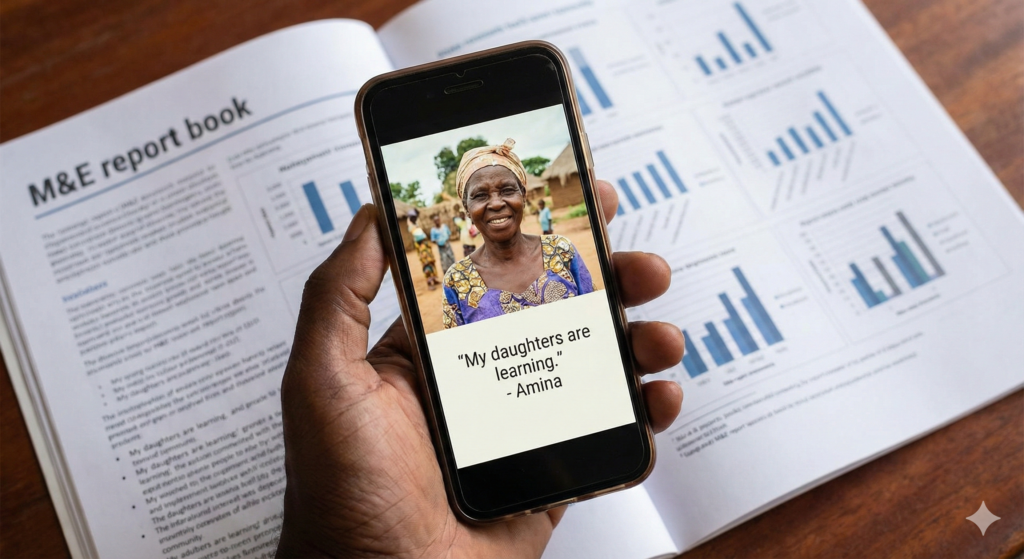
Version B (Story-Driven): “At 4 AM, Amina used to begin her daily water journey; a three-hour round trip carrying 20-litre jerrycans that left her back aching and her hands blistered. Her daughters accompanied her, missing school’s first period consistently. Today, with the community tap 200 meters from her home, those 2.3 hours have transformed into time for tending her kitchen garden and ensuring her daughters arrive at school by 7:30 AM. ‘My hands are healing,’ she told us, showing palms that no longer bear rope burns. ‘But more importantly, my daughters are learning.'”
Both communicate the same finding. Only one creates connection and understanding. The story version reveals how change happened, why it matters, and what it means for the people whose lives changed.
The Elements of Effective Evaluation Storytelling
- Cultural context: Place experiences within the social, economic, and cultural environment of the community. What constraints do people navigate? What resources do they draw on?
- Challenge and resilience: Don’t just report success, show how communities overcame obstacles. These stories of problem-solving and adaptation often contain the most valuable lessons.
- Local innovation: Highlight the creative strategies communities employed to make programs work in their specific context. These adaptations are often more replicable than the original program design.
- Voices and quotes: Use direct quotes judiciously but powerfully. Hearing from people whose lives changed brings findings to life in ways evaluator prose never can.
Case studies and anecdotes aren’t decorative additions; they’re essential interpretive tools that help readers understand not just what happened, but what it meant.
Feature 2: Recognize the Contributions of Local Actors and Partners
Most evaluation reports explain what was achieved and why, comparing actual results against expected outcomes. What they systematically fail to do is attribute achievements to specific stakeholders; the communities, local organizations, government officials, traditional leaders, and partner organizations who made success possible.
This omission isn’t just a courtesy issue; it reflects a fundamental misunderstanding of how development programs work. Programs don’t achieve results. People do.
The Power of Attribution
Research on contribution analysis in evaluation demonstrates that explicitly mapping who contributed what to observed outcomes provides several benefits:
- Validation: Local stakeholders are more likely to accept and act on findings when their contributions are acknowledged
- Learning: Understanding which actors drove which results helps identify what works and why
- Relationships: Recognizing partners strengthens evaluation credibility and future collaboration
- Empowerment: Attribution reinforces local agency and ownership rather than perpetuating donor-centric narratives
Practical Application:
Instead of: “The program successfully trained 500 health workers, resulting in improved maternal health outcomes.”
Write: “The Ministry of Health’s commitment to integrating trained community health workers into primary care facilities, combined with the Mothers’ Association advocacy that secured equipment funding and the District Medical Officer’s coordination of rotating mentorship visits, transformed training into sustained practice. These collaborative efforts resulted in 73% of trained health workers actively applying new maternal care protocols six months post-training; significantly above the typical 40% implementation rate observed in programs without such multi-stakeholder support.”
The second version recognizes specific contributions while explaining how different stakeholders’ actions combined to produce results. This level of understanding signals deep contextual knowledge and makes your report stand out.
Feature 3: Provide Evidence-Based M&E Insights Your Clients Don’t Already Have
Here’s an uncomfortable truth: clients hire evaluators not to confirm what they know, but to discover what they don’t. Your report must go beyond description to provide genuine insight findings that surprise, challenge assumptions, or reveal hidden patterns.
McKinsey research on what makes consulting engagements valuable found that 84% of clients define value as ‘learning something new that changes how we operate,’ not just validation of existing approaches.
What Counts as Genuine Insight
- Unexpected correlations: Connections between variables that weren’t part of the original theory of change
- Differential impacts: How program effects varied across population segments in ways program design didn’t anticipate
- Unintended consequences: Both positive and negative effects that weren’t expected but matter significantly
- Mechanism insights: Understanding not just whether something worked, but why and how it worked differently than expected
- Transferable lessons: Findings with implications beyond this specific program or context
The Evidence Foundation
Insights without evidence are speculation. Your findings must be measurable, credible, reliable, and verifiable. This means:
- Triangulation: Multiple data sources pointing to the same conclusion
- Quantitative rigour: Statistical analysis with appropriate sample sizes and significance testing
- Qualitative depth: Systematic coding and theme identification, not cherry-picked quotes
- Transparent limitations: Clear acknowledgment of what you can and cannot conclude from your data
Balance quantitative data with qualitative insights. Numbers tell you what happened and to what extent. Qualitative data reveals why and how. You need both to provide complete understanding.
Feature 4: Make It Visually Compelling and Scannable
Reading behaviour research shows that people don’t read evaluation reports linearly cover-to-cover. They scan, seeking specific information. If your report doesn’t accommodate this reality, it won’t be used, regardless of how brilliant your insights are.
Nielsen Norman Group’s usability research found that 79% of web users scan pages rather than reading word-by-word. This behaviour extends to document reading. Your report must work for scanners and deep readers simultaneously.
The Architecture of Scannable Reports
- Lead with findings: Start each section with the conclusion, then provide supporting evidence. Don’t make readers wade through methodology to reach insights.
- Layered detail: Executive summary for overview, body sections for main findings, annexes for technical detail. Let readers choose their depth level.
- Visual hierarchy: Clear headings, subheadings, and consistent formatting that guides the eye through the content
- White space: Dense paragraphs intimidate readers. Break content into digestible chunks with breathing room.
Beyond Walls of Text: Data Visualization
Replace descriptive paragraphs with visual elements that communicate findings faster and more memorably:
- Infographics: Distill key findings into visual one-pagers
- Interactive dashboards: Accompany static reports with Tableau or Power BI dashboards for data exploration
- Maps: Geographic visualization reveals spatial patterns text can’t capture
- Photos and videos: Visual documentation of change (with appropriate consent and ethical considerations)
- Testimonial boxes: Highlight powerful quotes in visually distinct formats
- Case study sidebars: Present detailed examples without interrupting main narrative flow
Research shows that people retain 65% of information paired with relevant images compared to only 10% of text-only information. Visual presentation isn’t decorative, it’s essential for comprehension and retention.
Feature 5: Drive Action with Clear, Prioritized, Feasible Recommendations
This is where most evaluation reports fail catastrophically. After 100 pages of rigorous analysis, they offer vague recommendations like ‘strengthen capacity,’ ‘improve coordination,’ or ‘increase resources.’ These aren’t recommendations, they’re aspirations disguised as advice.
The ultimate test of evaluation quality isn’t technical rigour or methodological sophistication. It’s impact. Does your report catalyze change? Do decision-makers act differently because of your findings? Evidence without impact is just paperwork.
A World Bank study analyzing 1,200 evaluation reports found that only 31% contained recommendations that were subsequently implemented. The primary barrier? Not lack of resources or political will, but recommendations that were too vague, too numerous, or insufficiently connected to organizational decision-making processes.
The Anatomy of Actionable Recommendations
1. Specificity Over Generality
Weak: “Strengthen monitoring systems to improve data quality.”
Strong: “Implement weekly data quality spot-checks by regional M&E officers covering 10% of health facilities randomly selected each week, with immediate feedback to facility staff and quarterly aggregate reports to Ministry leadership. Estimated cost: $15,000 annually; implementation timeline: 3 months.”
2. Prioritization: The Rule of Three
Twenty recommendations equal zero recommendations. Decision-makers face resource constraints and competing priorities. Your job is to identify the three most critical actions that will drive the greatest impact. Explicitly state: ‘If you can only implement three things from this evaluation, do these.’
3. Ownership Assignment
Every recommendation should specify who is responsible for implementation. Vague recommendations addressed to ‘the program’ or ‘stakeholders’ become everyone’s responsibility, which means no one’s responsibility.
4. Feasibility Assessment
Acknowledge resource requirements (time, money, technical capacity) and political feasibility. Recommendations that ignore constraints are fantasy, not guidance. Consider creating a recommendation matrix:
Recommendation Matrix
- Quick wins (High impact + Low cost + Easy implementation)
- Strategic priorities (High impact + Moderate cost + Medium difficulty)
- Long-term investments (High impact + High cost + Complex implementation)
5. Timeline Specificity
Replace ‘in the short term’ with ‘0-6 months.’ Replace ‘eventually’ with ’18-24 months.’ Specific timelines create accountability.
6. Evidence Linkage
Every recommendation should clearly trace back to specific findings. Decision-makers need to understand why you’re suggesting this action based on what evidence. Use explicit cross-references: ‘Based on Finding 3.2 that 67% of beneficiaries…’
Beyond the Report: Facilitating Action
The most action-oriented reports don’t stop at written recommendations. They include:
- Implementation roadmaps: Step-by-step guides for executing key recommendations
- Decision-support tools: Frameworks or checklists that help program staff operationalize findings
- Stakeholder-specific briefs: Tailored summaries for different audiences (executives, technical staff, community representatives)
- Follow-up workshops: Validation sessions that become action planning meetings
The best evaluators see themselves not as report writers but as change facilitators. Your report is one tool in a broader process of organizational learning and program improvement.
From Forgotten PDFs to Catalysts for Change
Remember that 127-page report gathering digital dust? Here’s what a memorable, action-driving version would look like:
- A 3-page executive summary that tells the story of change through three compelling case studies, leading with findings rather than methodology
- Explicit recognition of the community health worker association, district education office, and women’s cooperative whose collective efforts drove 80% of observed improvements
- Three surprising insights about unintended program effects that challenge assumptions and open new strategic directions
- Interactive data dashboards allowing stakeholders to explore findings by geography, demographic group, and time period
- Five prioritized recommendations with specific owners, timelines, resource requirements, and implementation guides-three of which were fully implemented within six months.
The difference? The second report was read. It got discussed. It influenced the next program cycle. It justified the evaluation investment. It created impact, not just documentation.
These five features: storytelling, stakeholder recognition, genuine insights, visual accessibility, and action orientation- don’t require dramatically more time or resources than conventional reporting. They require a different thinking about what evaluation reports are for.
Reports aren’t deliverables. They’re catalysts. Your evaluation has value only if it drives learning, influences decisions, and contributes to better programs and policies. Every choice you make in crafting your report should serve that ultimate purpose.
Discussion Questions for Your M&E Practice
Reflect on these questions to strengthen your reporting approach:
- What percentage of recommendations from your last three reports were actually implemented? What characterized the ones that drove action versus those that didn’t?
- Are you telling stories that connect readers to the people behind your data, or just reporting statistics?
- Do your reports recognize the specific contributions of local actors, or do they attribute success generically to ‘the program’?
- When was the last time a client said your evaluation revealed something genuinely surprising that changed their thinking?
- If you handed your report to someone with 10 minutes to spare, could they quickly grasp your key findings and what should be done about them?
Key Takeaways: Transform Your Reports from Forgettable to Impactful
- Stories create connection and understanding: use narratives to illuminate the meaning behind your data
- Attribute achievements to specific stakeholders: programs don’t achieve results, people do
- Provide evidence-based insights clients don’t already have: confirmation isn’t value, discovery is.
- Make reports scannable and visually compelling: accommodate how people actually read documents
- Prioritize specific, feasible, action-oriented recommendations: your report’s impact depends on implementation, not documentation.
Related Posts